Beginner tutorial
Introduction
This beginner tutorial will guide you through the basic ITL capabilites. For the sake of demonstration, we will assess the perfomance metrics of the digital product used by a bank. The bank name is going to be E_bank. Of course, when we speak about digital products, it is implied that we speak of e-banking web application.
What are we going to measure and assess?
We will define three metrics that will be used within this evaluation system. Metrics definitions (monitored on a monthly basis):
Metric 1: Number of complaints
Definition: The number of users' complaints about the web application performance.
Metric parameters:
| Parameter | Value |
|---|---|
| Fuzzy type: | Type 2 ↘️ |
| Ideal value (b) | 0 |
| Worst value (a) | 5 |
Metric 2: Newly issued credit cards
Definition: The number of newly issued credit cards
Metric parameters:
| Parameter | Value |
|---|---|
| Fuzzy type: | Type 1 ↗️ |
| Ideal value (b) | 400 pcs. |
| Worst value (a) | 100 pcs. |
Metric 3: Application screen time
Definition: The average period of time a user spends using the web application on a daily basis
Metric parameters:
| Parameter | Value |
|---|---|
| Fuzzy type: | Type 1 ↗️ |
| Ideal value (b) | 15 min |
| Worst value (a) | 1 min |
Assessment code
assessment "June Performance Assessment Report — E-Bank"
{
    # We define sets of metrics for the E-Bank
    metrics E_Bank
    {
        # Defining the Complaints metric
        Compl = (2,25,5)
        New_Credit_Cards = (369,100,400)
        Screen_Time = (7.4,5,15)
    }
    # Assess performance of the E-Bank
    grade E_Bank;
}
What are we going to get from the assessment?
Numerical result
> Metric grade:
______________
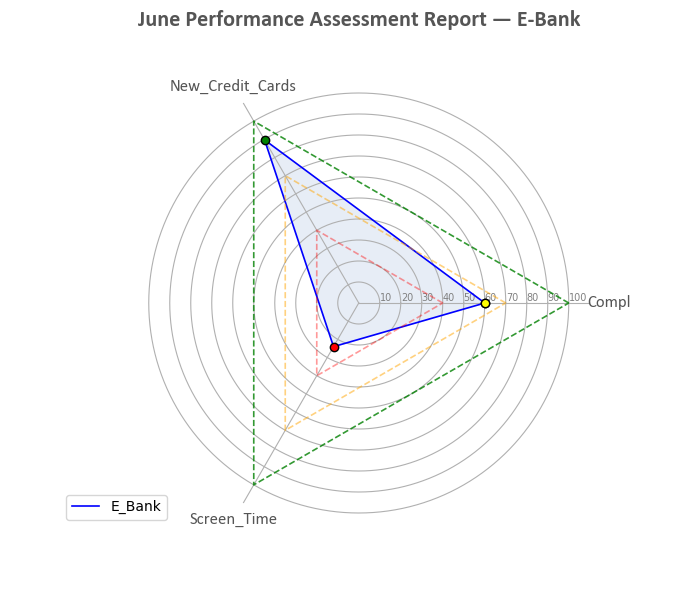
Metric set: {'E_Bank': {'Compl': 60.0, 'New_Credit_Cards': 89.667, 'Screen_Time': 24.0}}
Grade: 58/100 points
Grade zone: orange
> Code successufully executed.
Radar chart
Discussion
This documentation paragraph will be available soon.