Advanced tutorial
Introduction
This advanced tutorial will guide you through the basic ITL capabilites. For the sake of demonstration, we will assess the perfomance metrics of the three digital products used by three different banks operating under a single bank group. The bank names are going to be as follows:
E_bank_1, E_bank_2, and E_bank_3. Of course, when we speak about digital products, it is implied that we speak of e-banking web applications.
What are we going to measure and assess?
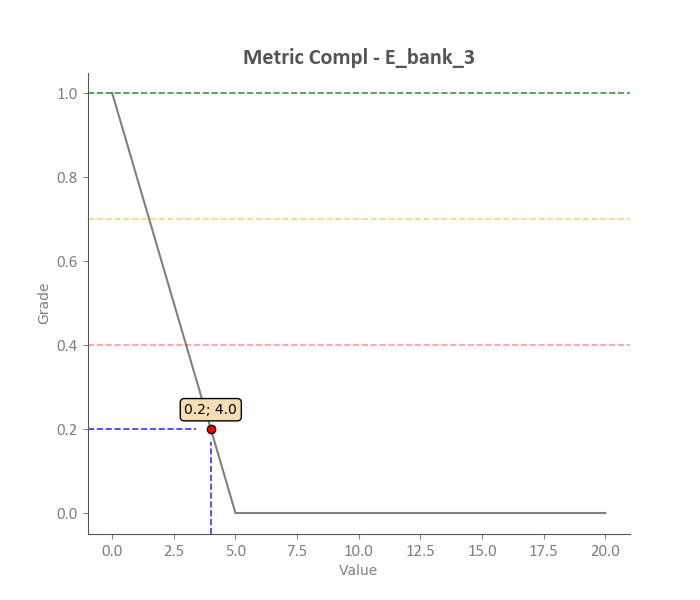
Metric 1: Number of complaints
Definition: The number of users' complaints about the web application performance.
Metric parameters:
| Parameter | Value |
|---|---|
| Fuzzy type: | Type 2 ↘️ |
| Ideal value (b) | 0 |
| Worst value (a) | 5 |
Metric 2: Loan lead time
Definition: The average amount of time that passes between application submission and loan approval
Metric parameters:
| Parameter | Value |
|---|---|
| Fuzzy type: | Type 2 ↘️ |
| Ideal value (b) | 0 days |
| Worst value (a) | 15 days |
Metric 3: Number of the approved loans
Definition: The number of approved loans
Metric parameters:
| Parameter | Value |
|---|---|
| Fuzzy type: | Type 1 ↗️ |
| Ideal value (b) | 500 |
| Worst value (a) | 30 |
Metric 4: Application screen time
Definition: The average period of time a user spends using the web application on a daily basis
Metric parameters:
| Parameter | Value |
|---|---|
| Fuzzy type: | Type 1 ↗️ |
| Ideal value (b) | 15 min |
| Worst value (a) | 1 min |
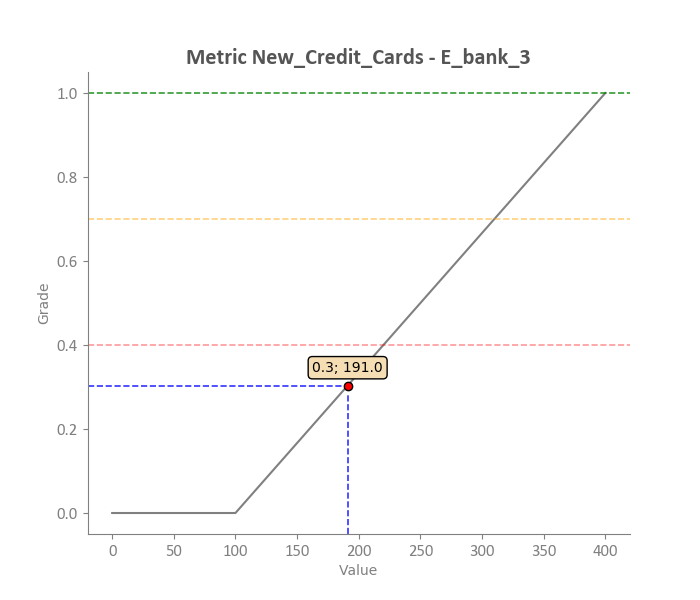
Metric 5: Newly issued credit cards
Definition: The number of newly issued credit cards
Metric parameters:
| Parameter | Value |
|---|---|
| Fuzzy type: | Type 1 ↗️ |
| Ideal value (b) | 400 pcs. |
| Worst value (a) | 100 pcs. |
Assessment code
assessment "June Performance Assessment Report - E-bank Group"
{

    # We define sets of metrics for all three banks
    metrics E_bank_1
    {
        # Defining the Complaints metric
        Compl = (3,20,5)
        New_Credit_Cards = (218,100,400)
        Screen_Time = (7.4,1,15)
        New_Loans = (305,30,500)
        Loan_Lead_Time = (4.43,30,15)
    }

    metrics E_bank_2
    {
        Compl = (1,20,5)
        New_Credit_Cards = (295,100,400)
        Screen_Time = (4.9,1,15)
        New_Loans = (352,30,500)
        Loan_Lead_Time = (8.82,30,15)
    }

    metrics E_bank_3
    {
        Compl = (4,20,5)
        New_Credit_Cards = (191,100,400)
        Screen_Time = (9.5,1,15)
        New_Loans = (254,30,500)
        Loan_Lead_Time = (2.52,30,15)
    }


    # Print out the overall grade of all three banks
    grade cumulative E_bank_1, E_bank_2, E_bank_3;

    # Individually assess the grades of each bank
    grade singular E_bank_1, E_bank_2, E_bank_3;

    # The third bank got the worst grade.
    # Let us examine why:
    grade E_bank_3;

    # The third bank made the worst result for metrics Compl
    # and New_Credit_Cards. Let us draw them so we
    # can examine them better:
    draw metric Compl, New_Credit_Cards from E_bank_3;

    # At the end, we will compare the overall success
    # of the first and second bank:
    grade comparative E_bank_1, E_bank_2;

    # In order to print all the original metrics data
    # we can use the following instruction:
    print E_bank_1, E_bank_2, E_bank_3;
}
What are we going to get from the assessment?
Numerical result
> Cumulative grade:
__________________
Metric sets: {'E_bank_1': {'Compl': 40.0, 'New_Credit_Cards': 39.333, 'Screen_Time': 45.714, 'New_Loans': 58.511, 'Loan_Lead_Time': 70.467}, 'E_bank_2': {'Compl': 80.0, 'New_Credit_Cards': 65.0, 'Screen_Time': 27.857, 'New_Loans': 68.511, 'Loan_Lead_Time': 41.2}, 'E_bank_3': {'Compl': 20.0, 'New_Credit_Cards': 30.333, 'Screen_Time': 60.714, 'New_Loans': 47.66, 'Loan_Lead_Time': 83.2}}
Grade: 52/100 points
Grade zone: orange
> Individual grades:
___________________
Metric set: E_bank_1
Grade: 70/100 points
Grade zone: green
Metric set: E_bank_2
Grade: 41/100 points
Grade zone: orange
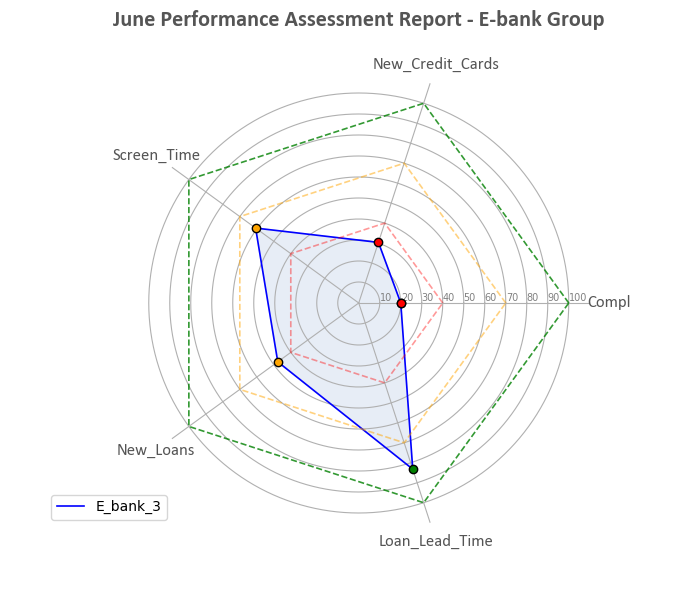
Metric set: E_bank_3
Grade: 83/100 points
Grade zone: green
> Leaderboard:
____________________________________
1. Metric set: ('E_bank_3', 83.2)
2. Metric set: ('E_bank_1', 70.467)
3. Metric set: ('E_bank_2', 41.2)
> Metric grade:
______________
Metric set: {'E_bank_3': {'Compl': 20.0, 'New_Credit_Cards': 30.333, 'Screen_Time': 60.714, 'New_Loans': 47.66, 'Loan_Lead_Time': 83.2}}
Grade: 48/100 points
Grade zone: orange
> Drawing metrics: E_bank_3
Compl 20.0
New_Credit_Cards 30.333
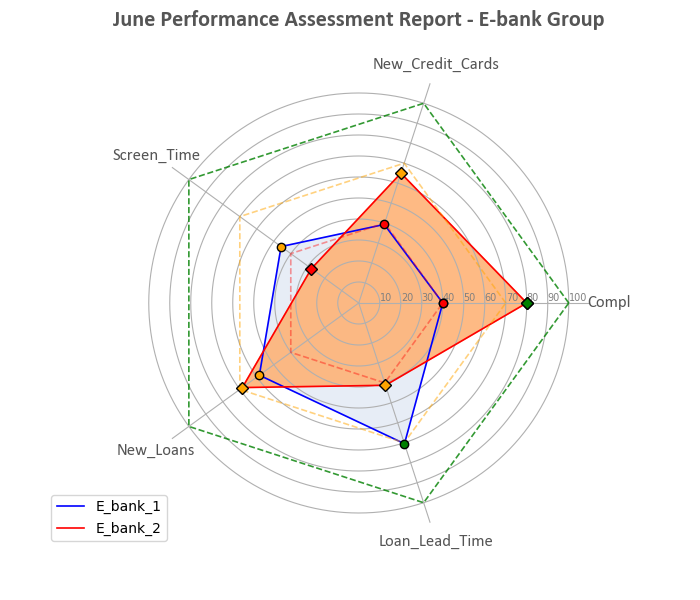
> Comparative grade:
___________________
Metric sets: {'E_bank_1': {'Compl': 40.0, 'New_Credit_Cards': 39.333, 'Screen_Time': 45.714, 'New_Loans': 58.511, 'Loan_Lead_Time': 70.467}, 'E_bank_2': {'Compl': 80.0, 'New_Credit_Cards': 65.0, 'Screen_Time': 27.857, 'New_Loans': 68.511, 'Loan_Lead_Time': 41.2}}
The metric E_bank_2 has 12% higer grade than the metric E_bank_1.
Grades: {'E_bank_1': 51, 'E_bank_2': 57}
> Metric sets values:
____________________
Metric: E_bank_1
Values: {'Compl': {'type': 'linear', 'data': {0: 3.0, 1: 20.0, 2: 5.0}}, 'New_Credit_Cards': {'type': 'linear', 'data': {0: 218.0, 1: 100.0, 2: 400.0}}, 'Screen_Time': {'type': 'linear', 'data': {0: 7.4, 1: 1.0, 2: 15.0}}, 'New_Loans': {'type': 'linear', 'data': {0: 305.0, 1: 30.0, 2: 500.0}}, 'Loan_Lead_Time': {'type': 'linear', 'data': {0: 4.43, 1: 30.0, 2: 15.0}}}
Metric: E_bank_2
Values: {'Compl': {'type': 'linear', 'data': {0: 1.0, 1: 20.0, 2: 5.0}}, 'New_Credit_Cards': {'type': 'linear', 'data': {0: 295.0, 1: 100.0, 2: 400.0}}, 'Screen_Time': {'type': 'linear', 'data': {0: 4.9, 1: 1.0, 2: 15.0}}, 'New_Loans': {'type': 'linear', 'data': {0: 352.0, 1: 30.0, 2: 500.0}}, 'Loan_Lead_Time': {'type': 'linear', 'data': {0: 8.82, 1: 30.0, 2: 15.0}}}
Metric: E_bank_3
Values: {'Compl': {'type': 'linear', 'data': {0: 4.0, 1: 20.0, 2: 5.0}}, 'New_Credit_Cards': {'type': 'linear', 'data': {0: 191.0, 1: 100.0, 2: 400.0}}, 'Screen_Time': {'type': 'linear', 'data': {0: 9.5, 1: 1.0, 2: 15.0}}, 'New_Loans': {'type': 'linear', 'data': {0: 254.0, 1: 30.0, 2: 500.0}}, 'Loan_Lead_Time': {'type': 'linear', 'data': {0: 2.52, 1: 30.0, 2: 15.0}}}
> Code successufully executed.
Radar chart
Comparative radar chart
Fuzzy rising metric - type 1
Fuzzy falling metric - type 2